ChartGemma, a novel chart understanding and reasoning model developed over PaliGemma. Rather than relying on underlying data tables, ChartGemma is trained on instruction-tuning data generated directly from chart images, thus capturing both high-level trends and low-level visual information from a diverse set of charts. Our simple approach achieves state-of-the-art results across 5555 benchmarks spanning chart summarization, question answering, and fact-checking, and our elaborate qualitative studies on real-world charts show that ChartGemma generates more realistic and factually correct summaries compared to its contemporaries. We release the code, model checkpoints, dataset, and demos at https://github.com/vis-nlp/ChartGemma.
Report issue for preceding element (View Highlight)
anguage-augmented vision foundation models or vision-language models (VLMs) have proven to be effective in tackling numerous real-world multimodal tasks such as visual segmentation, captioning, question answering, and generation and editing Li et al. (2023); Zhu et al. (2023). (View Highlight)
Though these models excel when used for general purpose applications in the wild, they often fail to tackle tasks that require specialized understanding and decoding of patterns and visualizations Han et al. (2023). (View Highlight)
Developing over the success of instruction-tuning enabling models to generalize to more tasks and applications Ouyang et al. (2022), there have been attempts at ’instruction-tuning’ VLMs to endow them the ability to understand charts in more realistic and fundamental settings Meng et al. (2024). These approaches generally depend on two crucial factors impacting their effectiveness: (i) Instruction-tuning dataset – these methods either use the underlying data tables from existing web sources Masry et al. (2024) or use synthetically generated data-tables Han et al. (2023) from LLMs such as GPT-4 OpenAI (2023) to curate the instruction-tuning data, and (ii) Base model – the existing methods either use chart-specific pre-trained models like UniChart Masry et al. (2023) or VLMs pre-trained with weak image-text alignment such as LLaVA Li et al. (2023). (View Highlight)
ChartGemma uses instruction-tuning data for chart representation learning that is directly generated from the chart images, capturing more diverse and relevant information while preserving complex visual features. This also enables us to utilize a much broader array of charts available across the web as we are not restricted by the availability of underlying data tables. ChartGemma develops over PaliGemma Chen et al. (2023) which has been trained on a much larger alignment dataset. Since ChartGemma uses PaliGemma as its backbone, it is also much smaller than existing chart understanding models, making it suitable for real-world applications. (View Highlight)
Figure 1: The instruction-tuning data generation process. Chart images are input into Gemini Flash 1.5, which generates visual chart instructions used to fine-tune our model, ChartGemma (please refer to § 2). (View Highlight)
we present the details of generating our instruction-tuning dataset. We start by curating a diverse corpus of charts that encompasses a range of visual styles and elements (§ 2.1), and then use it to generate the visual instruction-tuning data directly from the charts (§ 2.2). (View Highlight)
Our chart corpus is assembled using a combination of various sources across three categories: (i) Synthetically generated charts from sources such as PlotQA Methani et al. (2020), (ii) Curated charts from specialized websites such as Statista which typically exhibit limited visual diversity, and (iii) In-the-wild charts harvested from the broader web, such as WebCharts Masry et al. (2024), noted for their extensive stylistic variety. (View Highlight)
our method exclusively utilizes the chart images themselves for generating instruction-tuning data. This approach also allows us to bypass the constraints imposed by metadata availability. In total, our corpus consists of 122,857 chart images. (View Highlight)
We use chart images directly from the above assembled corpus to generate visual instruction-tuning data. This enables us to synthesize data that can train a model to capture not just point information, but complex trends and relations among the chart elements. (View Highlight)
we generate data across two categories: (i) predefined tasks, which align with common real-world scenarios and benchmarks, and (ii) open-ended tasks. (View Highlight)
Open-ended Tasks We enrich our instruction-tuning data by prompting the Multimodal LLM to generate a variety of tasks typical in real-world scenarios. This approach enhances the generalizability of our models and extends their applicability to diverse real-world settings. (View Highlight)
We use Gemini Flash-1.5 Team et al. (2023) due to its robust multimodal performance, cost-effectiveness, and high API rate limits. (View Highlight)
Visual Attributes Our instruction-tuning dataset features a wide range of instructions that emphasize the visual attributes of chart images. As illustrated in Fig. 7 in Appendix A.2, the examples highlight various visual elements such as lines, shapes, colors, trends, chart types, and positions, all of which are frequently referenced in real-world scenarios. These enhance the model’s visual reasoning capabilities, enabling real-world applications. (View Highlight)
Quality To demonstrate the strength of our approach in generating high-quality and accurate instructions, we evaluated 100 randomly sampled synthesized instructions. We found that our instructions accurately reflected the chart content in 82% of the cases, which is a significant improvement over the 61% accuracy reported for the ChartInstruct dataset Masry et al. (2024). Additionally, we observed 8% partially correct answers, similar to that as reported by ChartInstruct. We attribute this improvement in quality to our method’s reliance on the chart images, rather than using automatically generated and often erroneous data tables. (View Highlight)
Figure 2: ChartGemma architecture featuring the SigLIP vision encoder and the Gemma-2B language model. Visual tokens are depicted in red, prefix tokens in green, and suffix tokens in yellow. Full attention is applied between visual and prefix tokens (indicated by black lines), while causal attention is used for suffix tokens (indicated by purple lines) which are generated autoregressively. (View Highlight)
Vision Encoder: SigLIPReport issue for preceding element
Zhai et al. (2023) is a vision transformer (ViT) encoder . Unlike CLIP-like ViTs Radford et al. (2021) which use contrastive loss on large batches of image-text pairs, SigLIP is trained on single image-text pairs independently as a binary classification task. (View Highlight)
Language Model: Gemma-2BReport issue for preceding element
Team et al. (2024) is decoder-only transformer-based Vaswani et al. (2017) LLM trained on 3 trillion tokens with a context length of 8,196 tokens. Its pretraining data mainly consists of English documents, maths, and code, making it suitable for chart understanding tasks requiring strong reasoning capabilities. (View Highlight)
Existing chart VLLMs Meng et al. (2024) typically employ a two-stage training approach that requires an initial step to align the vision encoder and the LLM for understanding chart features, followed by instruction-tuning. In contrast, we only use a single-stage approach where we directly finetune the backbone model on our instruction-tuning data. We believe that the first stage is required by current methods as the VLLM backbones are aligned using a limited amount of image-text pairs with restricted styles and diversity. In contrast, our backbone, PaliGemma, has been trained end-to-end on 10 billion image-text pairs covering a wide variety of styles. This makes our model more adaptable and generalizable to different real-world images (e.g., charts, infographics, documents). We freeze the vision encoder and only finetune the LLM during instruction-tuning. This helps in reducing the computational complexity and also improves training stability given the small batch size used for instruction-tuning PaliGemma. (View Highlight)
We probe the effect of using PaliGemma as the backbone model for ChartGemma, which has better image-text alignment compared to other VLMs, on the downstream performance. We follow existing works Han et al. (2023); Masry et al. (2024) that use LLaVA Liu et al. (2023b) as a backbone and train LLaVA-1 with our instruction-tuning data. We compare this variant (LLaVA+Our dataset) with ChartGemma in Table 3 and observe that ChartGemma performs significantly better as compared to using LLaVA as our backbone. This validates our hypothesis that initializing our architecture with a strongly aligned model leads to better char understanding, reasoning, and generalization capabilities. (View Highlight)
Though using online LLMs like GPT4 as a judge has been shown to have a high correlation with human annotation Zheng et al. (2023), there haven’t been studies on measuring this correlation explicitly for chart understanding tasks. Hence, to ensure our observations, evaluations, and conclusions are robust, we perform a human study on the manually curated set of 100 charts, ’Web’. Similar to GPT4 evaluation, we compare the informativeness, factual correctness, and structure of the outputs generated by ChartGemma with ChartInstruct-LLaMA2. (View Highlight)
We have discovered the following three patterns of errors.
Report issue for preceding element
High Resolution Charts Charts with very large, often skewed dimensions, present challenges for our model, which uses an input resolution of 448x448. Resizing these large images can cause written text to become unreadable, leading to errors in the predicted labels and numerical values, as depicted in Fig. 13. Although PaliGemma offers a variant supporting up to an 896x896 input resolution, it operates significantly slower than the 448x448 version, making it impractical for use on consumer-level machines and GPUs.
Report issue for preceding element
Coding Errors While ChartGemma demonstrated state-of-the-art performance on the ChartQA benchmark, excelling in complex numerical reasoning and compositional questions, it occasionally generates erroneous code that cannot be executed. As depicted in Fig. 13, the model sometimes refers to undeclared variables within the code. We believe that integrating an LLM with enhanced coding capabilities could further improve our performance on the ChartQA benchmark.
Report issue for preceding element
Charts with Complex Visual Styles Although our instruction-tuning corpus predominantly features real-world charts from the broad web, ChartGemma tends to exhibit lower factual correctness and informativeness when evaluated on these charts compared to those from specialized websites like Pew or Statista, which have less visual diversity. This disparity, illustrated in Fig. 3, highlights the need for further enhancements to improve the generalizability of chart understanding models across various visual styles. (View Highlight)
Despite the effectiveness of our instruction-tuning approach and our model, there are notable limitations. Firstly, the instruction-tuning data is generated using a proprietary LLM, which could restrict the model’s use in certain commercial environments. Secondly, the input resolution of our model’s vision encoder is capped at 448x448; any increase in resolution leads to a quadratic rise in processing time. Third, we depend on the closed-source model, GPT4, for evaluating crucial metrics such as Informativeness and Factual Correctness. The frequent updates and potential deprecation of closed-source models pose challenges for the reproducibility of our results. Lastly, the model is prone to hallucinations, occasionally producing factually incorrect statements or erroneous code. We advise users to implement robust guardrails and exercise caution when deploying our model in real-world applications. (View Highlight)

 Figure 1: The instruction-tuning data generation process. Chart images are input into Gemini Flash 1.5, which generates visual chart instructions used to fine-tune our model, ChartGemma (please refer to § 2). (View Highlight)
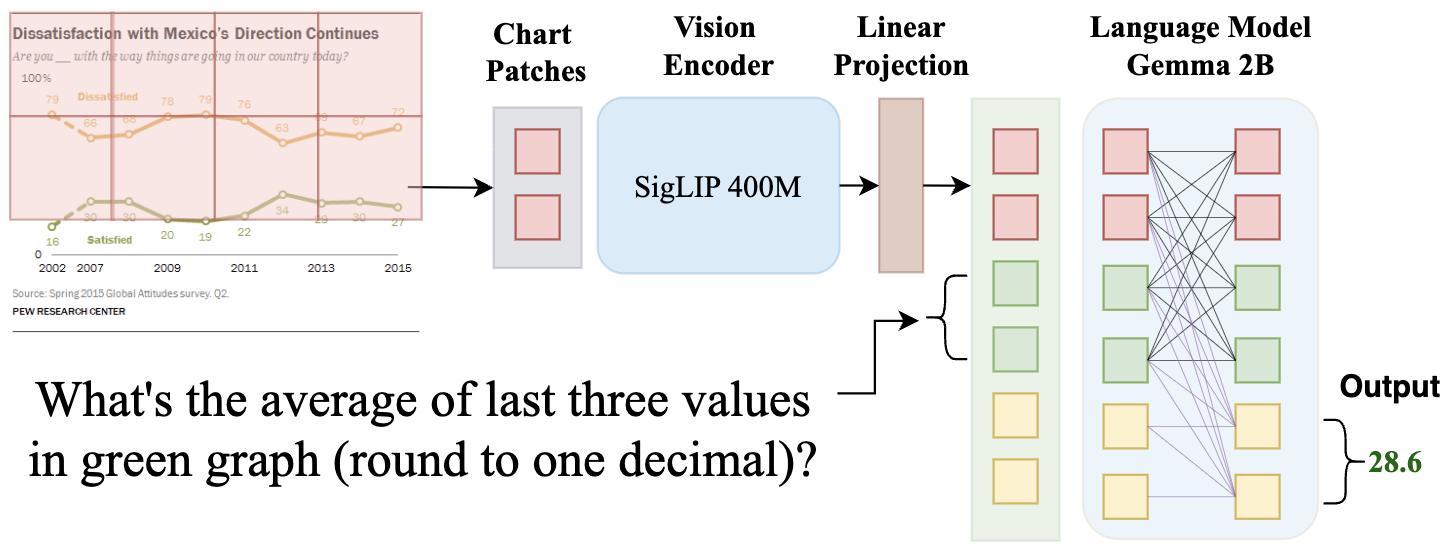 Figure 2: ChartGemma architecture featuring the SigLIP vision encoder and the Gemma-2B language model. Visual tokens are depicted in red, prefix tokens in green, and suffix tokens in yellow. Full attention is applied between visual and prefix tokens (indicated by black lines), while causal attention is used for suffix tokens (indicated by purple lines) which are generated autoregressively. (View Highlight)