Metadata
- Author: easystats.github.io
- Full Title: easystats: An R Framework for Easy Statistical Modeling, Visualization, and Reporting
- URL: https://easystats.github.io/easystats/
Highlights
- easystats is a collection of R packages, which aims to provide a unifying and consistent framework to tame, discipline, and harness the scary R statistics and their pesky models. However, there is not (yet) an unique “easystats” way of doing data analysis. Instead, start with one package and, when you’ll face a new challenge, do check if there is an easystats answer for it in other packages. You will slowly uncover how using them together facilitates your life. And, who knows, you might even end up using them all. (View Highlight)
- Each easystats package has a different scope and purpose. This means your best way to start is to explore and pick the one(s) that you feel might be useful to you. However, as they are built with a “bigger picture” in mind, you will realize that using more of them creates a smooth workflow, as these packages are meant to work together. Ideally, these packages work in unison to cover all aspects of statistical analysis and data visualization. • report: 📜 🎉 Automated statistical reporting of objects in R • correlation: 🔗 Your all-in-one package to run correlations • modelbased: 📈 Estimate effects, group averages and contrasts between groups based on statistical models • bayestestR: 👻 Great for beginners or experts of Bayesian statistics • effectsize: 🐉 Compute, convert, interpret and work with indices of effect size and standardized parameters • see: 🎨 The plotting companion to create beautiful results visualizations • parameters: 📊 Obtain a table containing all information about the parameters of your models • performance: 💪 Models’ quality and performance metrics (R2, ICC, LOO, AIC, BF, …) • insight: 🔮 For developers, a package to help you work with different models and packages • datawizard: 🧙 Magic potions to clean and transform your data (View Highlight)
- You’ve probably already heard about the tidyverse, another very popular collection of packages (ggplot, dplyr, tidyr, …) that also makes using R easier. So, should you pick the tidyverse or easystats? Pick both!
Indeed, these two ecosystems have been designed with very different goals in mind. The tidyverse packages are primarily made to create a new R experience, where data manipulation and exploration is intuitive and consistent. On the other hand, easystats focuses more on the final stretch of the analysis: understanding and interpreting your results and reporting them in a manuscript or a report, while following best practices. You can definitely use the easystats functions in a tidyverse workflow!
easystats + tidyverse = ❤️ (View Highlight)
- Can easystats be useful to advanced users and/or developers? Yes, definitely! easystats is built in terms of modules that are general enough to be used inside other packages. For instance, the insight package is made to easily implement support for post-processing of pretty much all regression model packages under the sun. We use it in all the easystats packages, but it is also used in other non-easystats packages, such as ggstatsplot, modelsummary, ggeffects, and more. (View Highlight)
- Dependencies
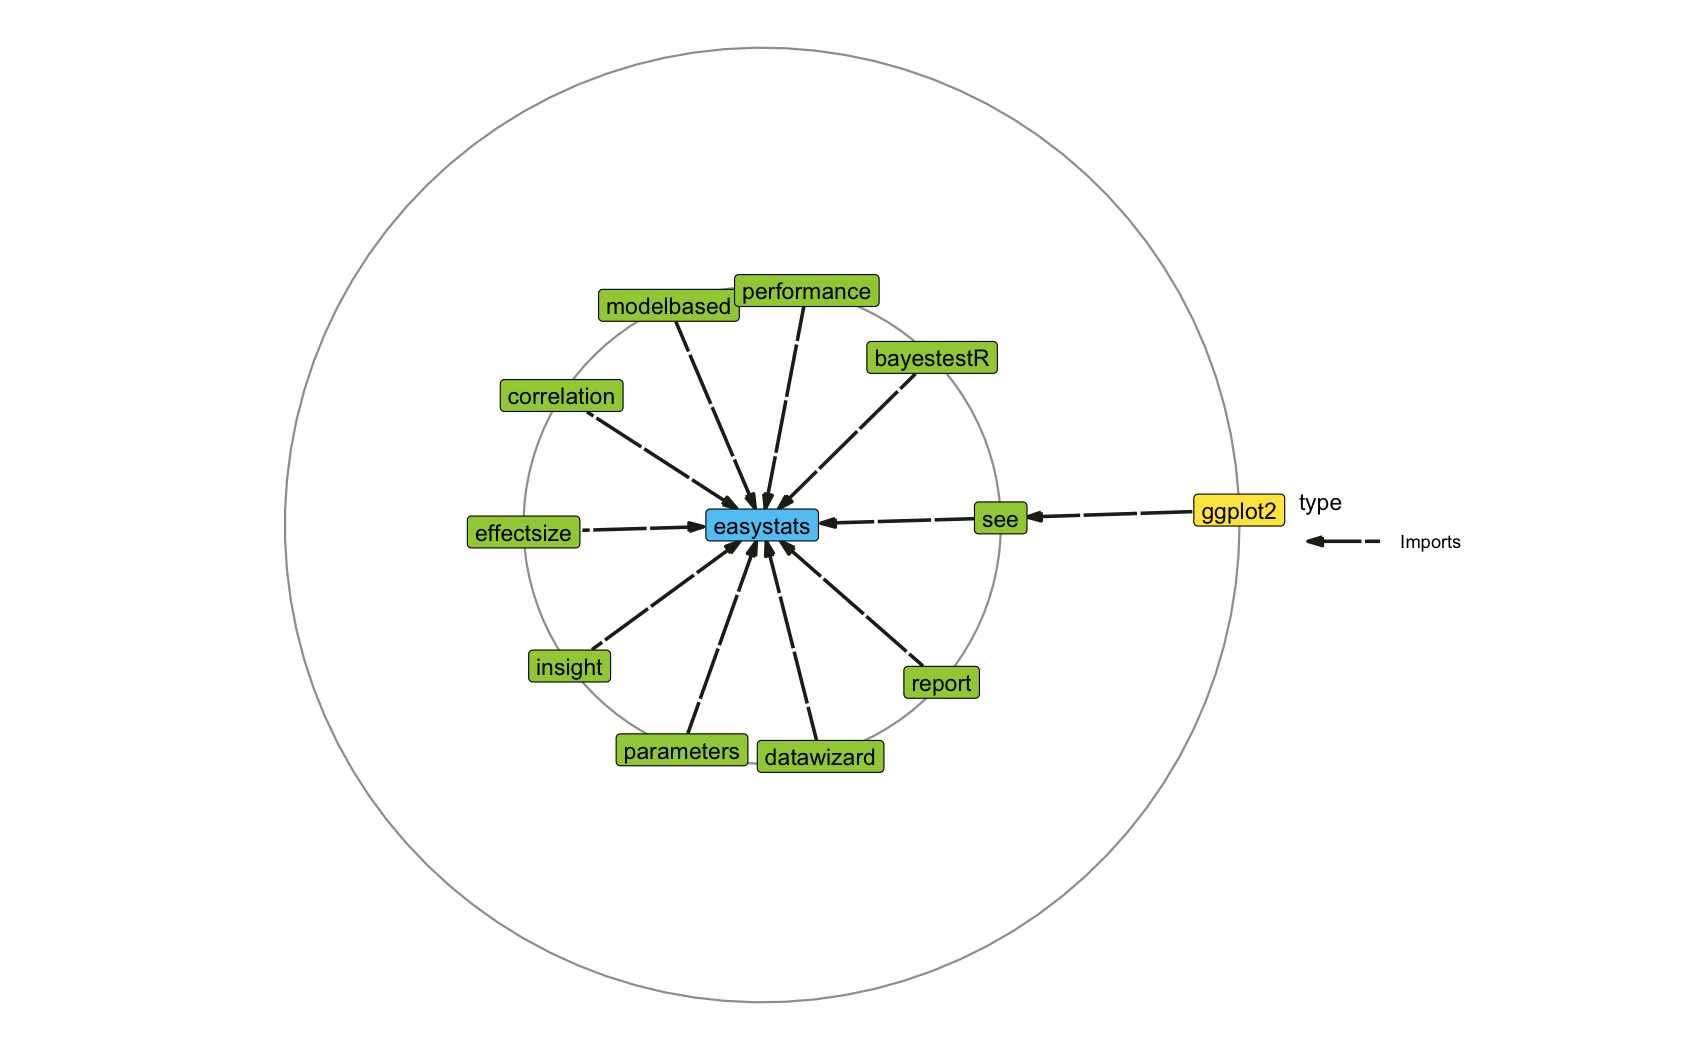
easystats packages are designed to be lightweight, i.e., they don’t have any third-party hard dependencies, other than base-R packages or other easystats packages! If you develop R packages, this means that you can safely use easystats packages as dependencies in your own packages, without the risk of entering the dependency hell.
library(deepdep)
plot_dependencies(“easystats”, depth = 2, show_stamp = FALSE)
 As we can see, the only exception is the
 {see}package, which is responsible for plotting and creating figures and relies on ggplot2, which does have a substantial number of dependencies. (View Highlight)